pg_statviz 0.7 released with new features, PG17 support
I'm pleased to announce release 0.7 of pg_statviz, the minimalist extension and utility pair for time series analysis and visualization of PostgreSQL internal statistics.
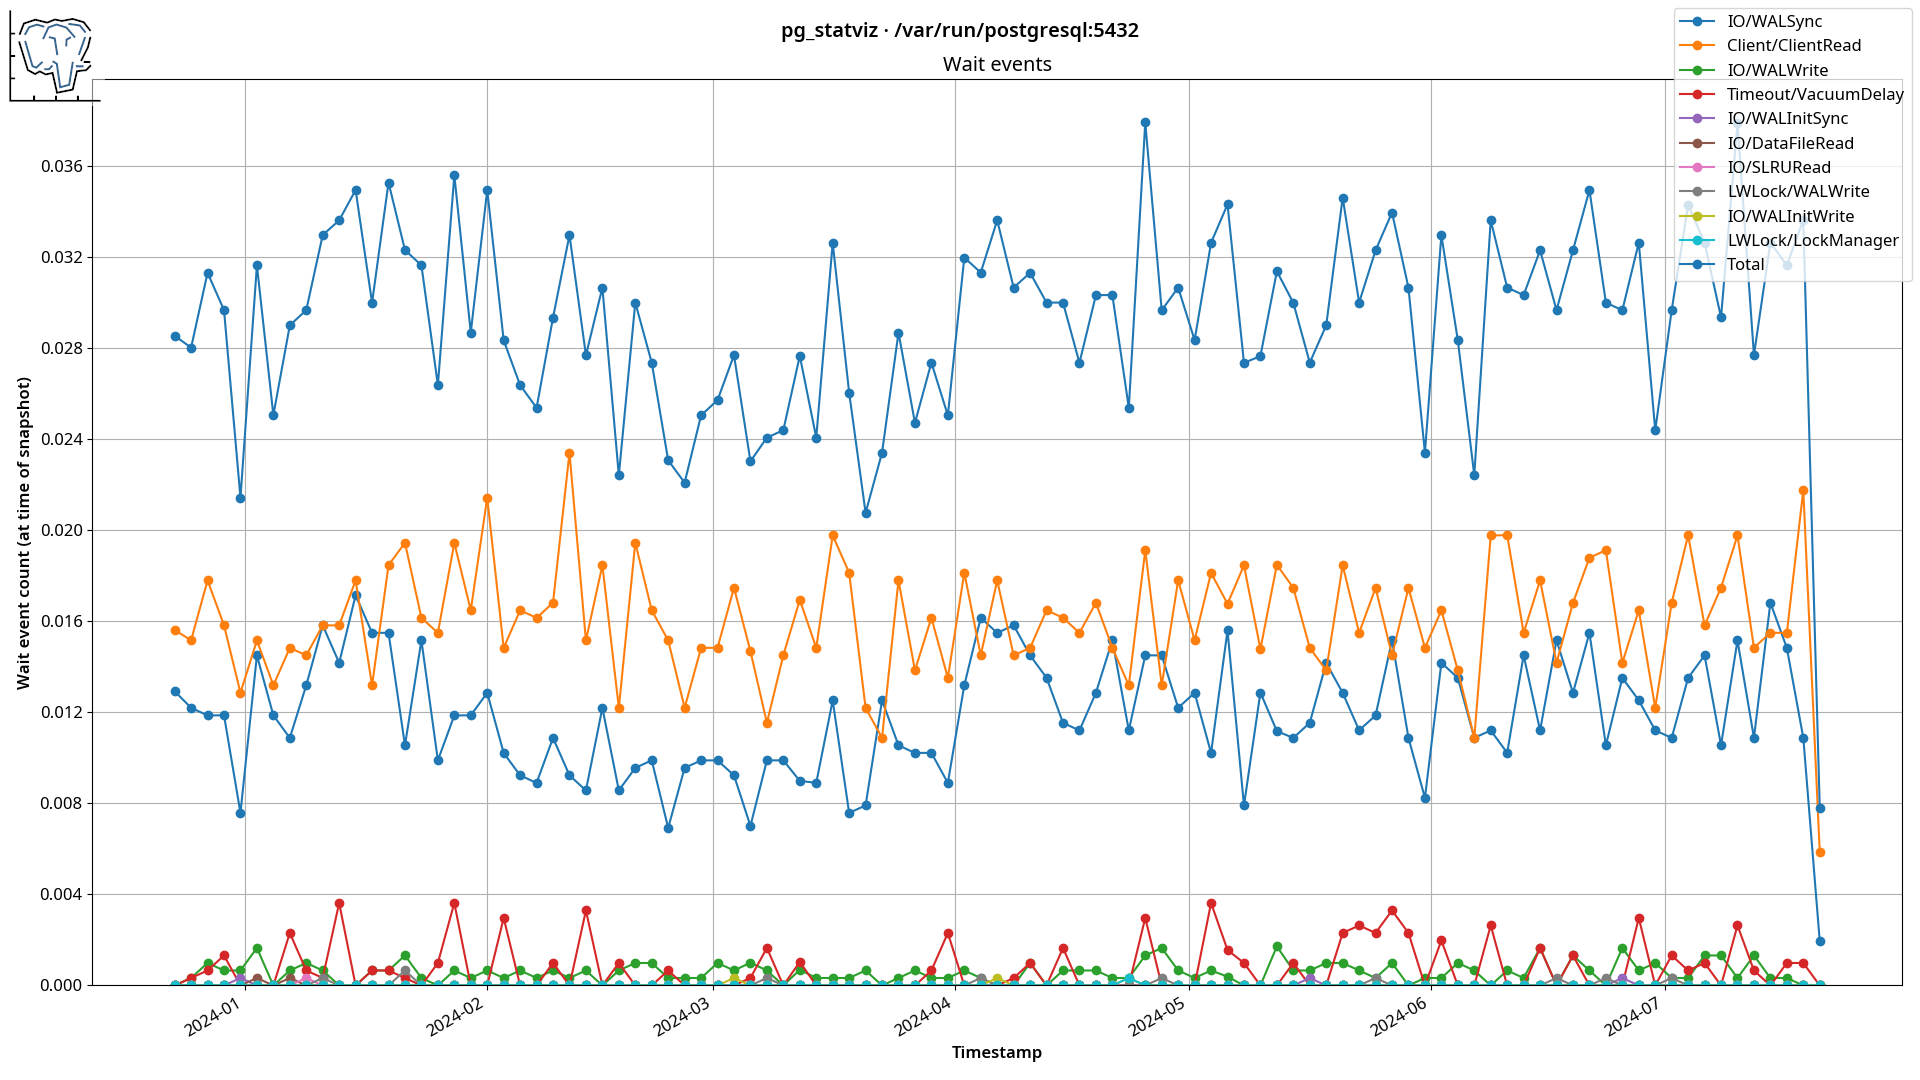
This release comes with a huge new feature: the implementation of resampling with pandas to permit effectively unlimited data analysis. Now you can take thousands, potentially millions of full statistics snapshots and squash all those data points to just 100 plot points (by default, using downsampling with mean values) to enable you to get a long-term view of your system's performance and statistics.
 The chart above shows what 7 months of wait event statistics (over 300,000 data point snapshots) look like, downsampled to just 100 plot points.
Other new features:
- The addition of server I/O stats from the view
pg_stat_io, which was added in PostgreSQL 16. - Update for the upcoming PostgreSQL 17 release:
pg_stat_bgwriterhas been broken up, and some stats have been moved to other views. - The JSONB in the
conftable, which stores Postgres configuration snapshots, has been changed from{"setting": "work_mem", "value": "4MB"}to{"work_mem": "4MB"}to save approximately half the storage space on disk.
pg_statviz takes the view that everything should be light and minimal. Unlike commercial monitoring platforms, it doesn't require invasive agents or open connections to the database — it all lives inside your database.
The extension is plain SQL and pl/pgSQL and doesn't require modules to be loaded, the visualization utility is separate and can be run from anywhere, and your data is free and easy to export.
- You can download and install
pg_statvizfrom the PostgreSQL repositories or PGXN. - The utility can also be installed from PyPi.
- Manual installation is also possible.
 / blog